
Defining Your Niche in a Saturated Market: Using Spectrums to Differentiate Your Business
It’s safe to say that every market is a saturated market these days. Just when you think the world has enough graphic designers, wedding photographers, or nail salons, another one pops up.
Traditional business advice will tell you to “find your niche”, that is, offering something very specific that no one else can. But in today’s market, it’s less about offering something completely unique and more about offering your “thing” in a way that none of your competitors currently do.
The key to finding it? Spectrums.
What to do: Let’s pinpoint a few common traits a design agency might have, like:
1. How heavily involved a client is in the design process.
2. Whether a company is known for their process or turning work around quickly.
3. Their pricing.
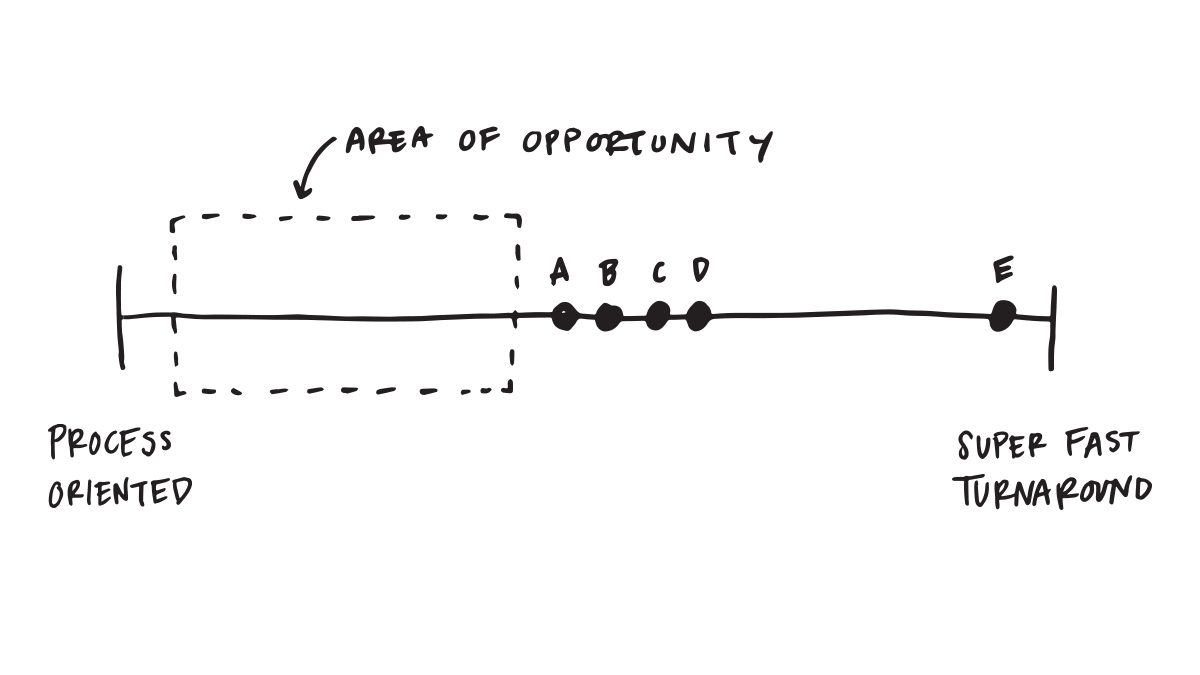
Draw a spectrum for each of these traits, with opposite values on either end. Then, do some digging and place your competitors along the scale appropriately (seen below as letters A-E). The spaces in between and around those points can be define as “areas of opportunity” and are where you can most easily carve out a place in the market.


Grouping together with a bunch of other businesses isn’t necessarily the “wrong” way of doing business, just know that you won’t own a gap in the market and will need to invest extra time (and money) into differentiating your business through branding, marketing, and user experience. All of this is to stay, there won’t always be giant gaps as shown above (or maybe much gap at all), but it’s a good way to have a broader view of where your competitors stand.
On the topic of geeking out to competitor data: an axis graph is another great tool for mapping out competition, especially when you want to gather more than two factors as once. Let’s say you want to know where the market stands in terms of agency size and cost of goods. You’d sketch out an axis graph like so:

In this example, the agency size would take the North-South axis, while the cost of goods would occupy the East-West (or vice versa). Simply plot general points of where other agencies land and take note of large holes or gaps.
A few examples of axis graph traits based on business types:
Wedding Photographer (Goal: to find offering “sweet spot”)
NS Axis: Digital only > Film only
EW Axis: $1500/wedding > $5,000/wedding
Pro tip: giving Cost of Goods an exact dollar amount (like $500 > $5000) is even more helpful.
Lifestyle Blogger (Goal: to develop Instagram strategy)
NS Axis: Mom/Family Blogger > Fashion/Style Blogger
EW Axis: 1 Instagram post per day > 5 Instagram posts per day
Local Boutique (Goal: to determine which products sell best)
NS Axis: 0-5 Years in Business > 6-10 Years in Business
EW Axis: Clothing & Accessories > Home & Decor
Defining a niche sometimes is less about offering a super unique product and more about offering something that is unique from the way others are offering it.
If you found this post helpful, drop a comment below! We’d love to hear from you.